New tool in Scotland may help prioritize river management decisions
December 6, 2018
Greater Thames Estuary Fish Migration Roadmap
January 16, 2019
OLYMPUS DIGITAL CAMERA
Modelling Fish Habitat to Determine the Impacts of Barriers
Many barriers drastically modify the character of the adjacent river. Dam impoundments change the river into standing ponds and may eradicate the riverine fauna. Downstream sections are frequently impacted by rapidly changing flows, temperature or modified channel bed structure. Consequently, creating facilities passing the fish on the other side of the barrier may not be effective if down or upstream habitat are unsuitable for their survival. Therefore, it is necessary also to investigate and manage the habitat conditions up and downstream of the barriers.
Our team within AMBER works to increase the information and understanding of barrier impacts. Currently, we are developing techniques to model fish habitat used to determine the impact of barriers on up- and downstream sections of the river and their habitats. The first step is to determine benchmark conditions to which we can compare barrier impacted habitats. Therefore, as part of this project, we developed a GIS map that represents European Fresh Water Bodies classified according to the Fish Community Macro Habitat Types, which support reference structure of the fish.
Using available, Europe-wide databases containing the information about environmental characteristics and electrofishing data, we attempted to analyse the relationship between the physical setting and expected, reference fish community structure. The European Intercalibration database, gathered during the fisheries methods intercalibration process conducted between 2006-2011 under auspices of European Commission Joint Research Centre - JRC (WFD Intercalibration 2011), was selected for the analysis. The database contains over 5000 records from 23 countries. Permissions to use the data were received from 19 countries.
Methods
This biological data is represented by abundance of captured fish species divided into Habitat Use and Tolerance guilds derived from studies conducted in earlier EU funded projects (EFI+). The proportion composition of guilds found in reference sites, with select environmental attributes of those sites determined the macrohabitat typology of the waterbodies.
The environmental attributes used in the statistical analysis are: size of catchment, altitude, surficial geology, valley slope, bioregion and Strahler stream order. This macro scale attributes are insensitive to human induced alterations and therefore allow to establish physiographic relationships to biota representing reference state. The database also includes information about human disturbances that allowed us to select non-disturbed reference sites for model calibration.
Two step cluster and discriminant analysis was used for the statistical calculations and created robust model (R=0.937, p<0.001) of 8 habitat classes. The 9th class was added by expert review through splitting the last 8 according to geographic position of the sites (Scandinavian and Mediterranean). For each of those Fish Community Macro Habitat Type (FCMacHT) classes a template structure model of Expected Fish Community representing Habitat Use and Tolerance (HUT) guilds proportions was developed using Target Fish Community approach.
In subsequent steps, Classification and Regression Trees (CART) model has been applied to develop classification trees presenting the relationship between the macro scale environmental attributes and FCMacHT class. This allowed to assign those classes to the data from disturbed sites. The model offered 92% of correct classification (Figure 1).
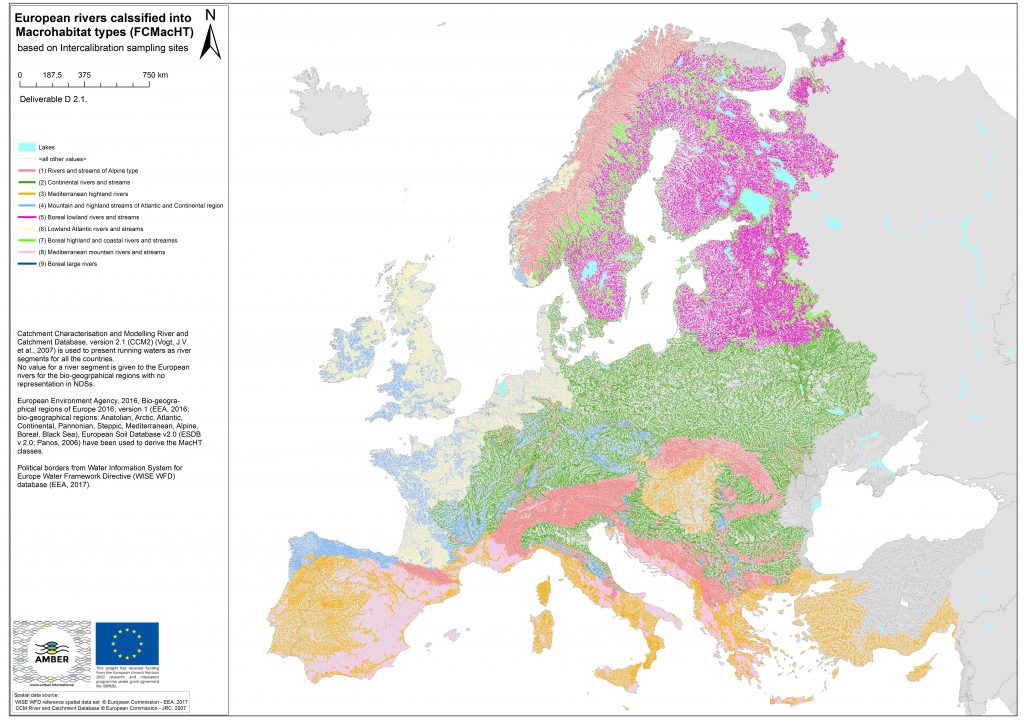
Figure 1. The FCMacHT classes plotted on the map for the waterbodies available in European Databases. The base map used is a combination of Water Information System for Europe Water Framework Directive reference spatial data sets (WISE WFD, EEA, 2017) and Catchment Characterisation and Modelling River and Catchment Database, version 2.1 (CCM2) (Vogt et al. 2007).
The European macrohabitat river types (FCMacHT) is based on a number of physio-geographic factors associated with Expected Fish Communities (EFC). The 9 river types distinguished at a continental scale are however broad and various combinations of smaller habitat unit types may be recorded in each type. The habitat survey with help of MesoHABSIM modelling is a next step to more precise determination of the actual conditions for aquatic organisms at a given site under various hydrological conditions.
The purpose and background of the tool
Mesohabitat Simulation Model (MesoHABSIM) is an approach for modelling instream habitats. It consists of a data collection strategy and analytical techniques that allow the user to compute how much habitat is available for investigated fauna under specific environmental circumstances. It builds upon pre-existing physical habitat simulation models (e.g. PHABSIM) to predict an aquatic community's response to habitat modification. The model captures variations in stream morphology along the river into account and relates it to distribution of aquatic fauna. Mesohabitat types are defined by their hydromorphological units (HMUs), such as pools and rapids, geomorphology, land cover and other hydrological characteristics. Distribution of fish is observed in large number of HMU’s. Based on habitat characteristics of these units, mathematical functions describing relationship with fish abundance are calculated. The functions are used to predict the probability of species occurrence for each mapped mesohabitat.
Mesohabitats are mapped under multiple flow conditions at extensive sites along the river. This allows modelling of available fish habitat at a range of flows.
The results of MesoHABSIM create the framework for integrative analyses of many aspects of the ecosystem. It also allows managers to recreate reference conditions and evaluate possible instream and watershed restoration measures or alterations, such as dam removals or changes in water withdrawals. From the perspective of resource managers, it not only allows for quantitative measures of ecological integrity, but also creates a basis for making decisions where trade-offs between resource use and river restoration need to be considered.
Habitat modelling concept
Research has shown that the combination of streamflow variability and river mor¬phology (along with other factors such as water quality, energy inputs and biotic interactions) is a primary control on the processes that determine the composition and dynamics of stream ecosystems (KARR et al. 1986; STATZNER et al. 1988; MINSHALL 1988; HILDREW & TOWNSEND 1994; POFF & WARD 1989).
Following the development of the ecological niche theory (HURCHINTSON 1957), it became clear that living organisms can be affected by the variability of their whole environment. The observation that the aquatic animals respond to specific physical patterns in a stream, both at the population level over long periods of time and directly to patterns of physical habitat over a shorter timeframe, has provided the background for development of physical habitat models. Although physical variables are clearly not the only factors affecting abundance and health of organ¬isms in rivers (KARR et al. 1986), they provide effective assessment criteria due to their history of anthropogenic impact, predictability and ease of measurement (STALNAKER 1995).
In general, modelling of riverine physical habitat consists of two major procedures that together lead to an assessment of the impacts of various management options. Biological sampling is applied to determine habitat use by selected fish and/or invertebrate species. Spatial measurement provides a description of the morphologic/hydraulic habitat conditions in the studied water at a range of flows. Changes in these conditions with changing discharge can then be determined and variation in habitat suitability thus evaluated.
The selection of the variables used in physical habitat models arose from em¬pirical studies which demonstrated the association of fish (and invertebrates) with particular physical and chemical aspects of their available habitat (BININs & ElSERMANN 1979; JUNGWIRTH 1988; MILNER et al. 1985; RABENI & JACOBSON 1993: WRIGHT et al. 1993). The step was taken to link simple physical habitat use/description models to hydraulic models capable of predicting the variation of the key habitat variables in an incremental fashion (BOVEE 1982; GORE & NESTLER 1988). This allowed simulation of the relationship between stream discharge and an aggregate physical habitat quantity for life stages of a target aquatic species (e.g. fish). Thus, researchers simplified the analysis of anthropogenic changes (ORTH 1987) by modelling only the key habitat variables likely to change (which can also be measured relatively easily), and linking these with the preferences of aquatic species.
Data types
There are three major types of physical attributes that are incorporated in habitat modelling process: hydraulics, riverbed geometry and habitat dressing. Hydraulics includes the basic data on hydrology of the investigated river section, including characteristic multiannual average flows (average low flow, low flow threshold, medium flow threshold). The first step in preparation of a MesoHABSIM survey is to select the range of flows that will be closely analysed in the model. Field surveys are conducted usually at low flows, up to a low/medium flow threshold. These may vary with project objectives as well as with the investigation season. The MesoHABSIM surveys consist of multiple observations of at least three flows within the above range. This is the lowest number of observations necessary to develop habitat flow rating curves. At each flow condition, a set of measurements of water velocity and depth is taken in every HMU to assess the hydraulic parameters distribution.
Geometry of the river channel determines the number and distribution of HMU’s on investigated river section. This is assessed by HMU’s identification and measurements of water depth and substrate composition. In deep and narrow river beds runs, fast-runs, rapids and pools prevail, while in rivers with broad channel and flat banks glides, backwaters, riffles, or side arms are more frequent. Also, river slope is key factor for river channel geometry and habitat variability. Habitat dressing describes complexity and diversity of HMU, related to suitability for various groups of aquatic organisms. Features such as canopy shading, woody debris, water vegetation, boulder rocks, shallow margins, undercut banks, etc. are noted for each HMU in a simple scale (absent, present or abundant). Land use on both shores is also registered.
Flow chart
The flow diagram in Figure 2 and associated text in this section provide a step-by-step decision making guide.
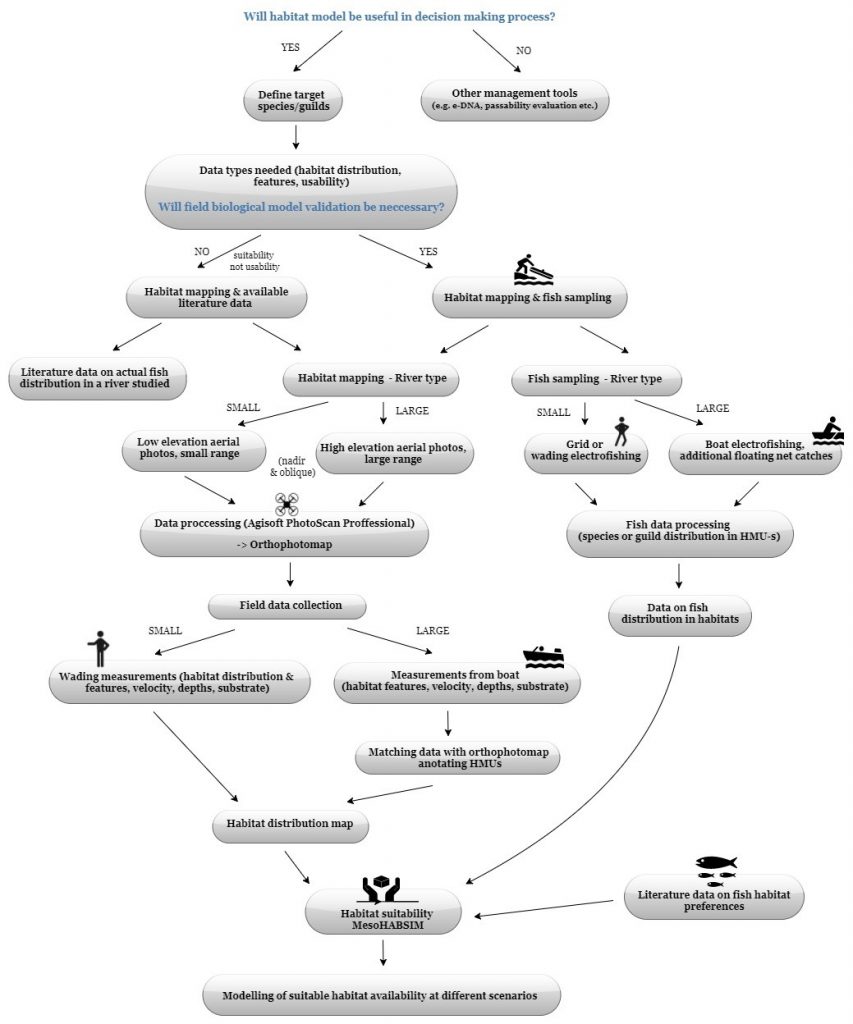
Figure 2. Decision tool and guidance for habitat model surveys (Study design).
Data collection process
Habitat mapping
The habitat survey’s goal was to determine the spatial proportions of mesohabitat units in selected project river sections. Mesohabitat units or Hydromorphological Units (HMUs) are river sections with similar morphologic, hydraulic, and cover attributes (i.e. pools, riffles, runs). For each HMU, the location is determined with GPS in conjunction with high-resolution aerial photographs, creating a detailed map of selected sites on the river. The outlines of each HMU are drawn as geo-referenced polygons on a surveying unit such as Android tablet. Determine the extent of the first HMU as follows. Walk or canoe the river and pay particular attention to the water surface characteristics (ripples, slope), river bottom morphology and uniformity of bank and shore-use characteristics. Continue moving downstream until a noticeable change in one of these characteristics occurs.
Note the location of this change and draw a polygon on a field computer to account for that HMU. When you complete the drawing a data entry form will appear and you can record the observed attributes in appropriate fields (Figure 3). Record the observed characteristics including: the meso-habitat type, dominate substrate and wetted/bankfull width. Next indicate the absence (<5% of area), presence (≤50%) or abundance (>50%) of instream habitat attributes such as: boulders, woody debris and undercut banks. Finally, fill out shoreline attributes, which include information on land use, erosion and irregular shores and comments (see Parasiewicz 2007a for list of all attributes).
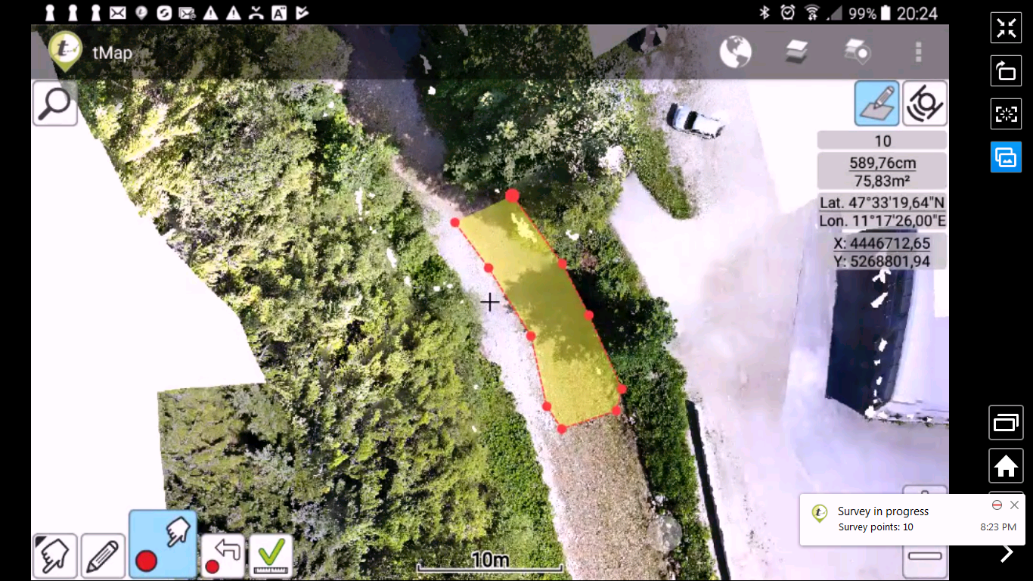
Figure 3. Screenshot of the T-map settings during polygon annotation. In the left lower corner, you can choose between input devices: GPS, laser range finder or finger. The second button allows you to edit the drawn polygon. The middle button is activated to allow drawing and the one to the right of it allows to remove most recently drawn point. The green check mark closes the polygon and opens attribute table. The table to the right is a form that shows up after pressing the check mark.
Habitat survey for fish
The electrofishing survey is conducted in conjunction with hydromorphological units mapping on the river. For this purpose, pre-exposed area electrofishing grids (PAE) are usually used. Once the grids are deployed in HMU-s it is necessary to wait at least 10-15 minutes before electrofishing. This is the minimum period for fish to return to their habitat (Bain et al. 1985). In each of selected HMUs from 2 to 5 grids are located depending on area of investigated habitat. HMU complexity (e.g. amount of covers, water velocity and depth or substrate variability) should be represented within sampled area. All captured fish are determined to the species and total length is measured with accuracy of 1 mm. After the measurements, fish are released downstream from the analyzed reach to avoid catching them in next samples. For each grid location, specific environmental variables on HMU type, river location, and habitat characteristics (stream depth and velocity, substrate, gradient and covers) are recorded as described above.
The other available method that may be applied is electrofishing in accordance with fish based ecological status monitoring standards (CEN EN 14011 2003). In case of the wading method samples are taken using portable aggregate. The operator moves against the river current – in upstream direction: in the case of narrow watercourses, or by moving diagonally from one bank to the other. Minimum length of selected sampling site is 100 m. To assess fish distribution in particular HMUs this method should be modified. Prior to electrofishing HMUs are delineated and all measurements are done as described above. In each HMU, a transect of known length (5-20 m depending on habitat patch size), covering habitat diversity is marked with the small buoys. Every transect is sampled separately by wading against the current (the minimum time for fish return to their habitats before sampling starts should be maintained). All other procedures are same as for PAE sampling.
Both electrofishing methods are applicable and effective in rivers of a depth up to 2 m (Figure 4).
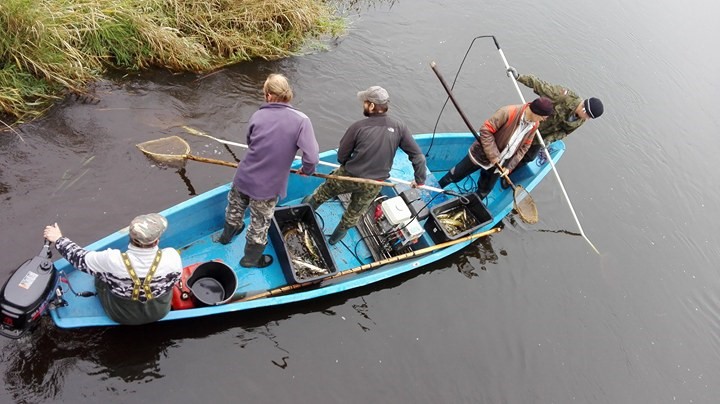
Figure 4. Boat electrofishing on a large river, phot. Katarzyna Suska SSIFI
The data collected with above and similar techniques is used to quantify the amount of river area that serves as habitat suitable for Expected Fish Community. Habitat rating curves represent changes in the area of suitable habitat for species and communities in response to flow and allow for the determination of habitat quantity at any given flow within the range of surveys (Figure 5). These rating curves can be developed for river units of any size making them useful for drawing conclusions about the suitability of channel patterns or habitat structures for specific sections as well as for the entire river. They are also a tool to demonstrate the results of simulations performed through changes in river morphology and hydrology. Such that it can serve developing representation of reference conditions (i.e. without the barrier) and compare with current habitat availability for Expected Fish Community as defined in FCMacHT model (Figure 1).
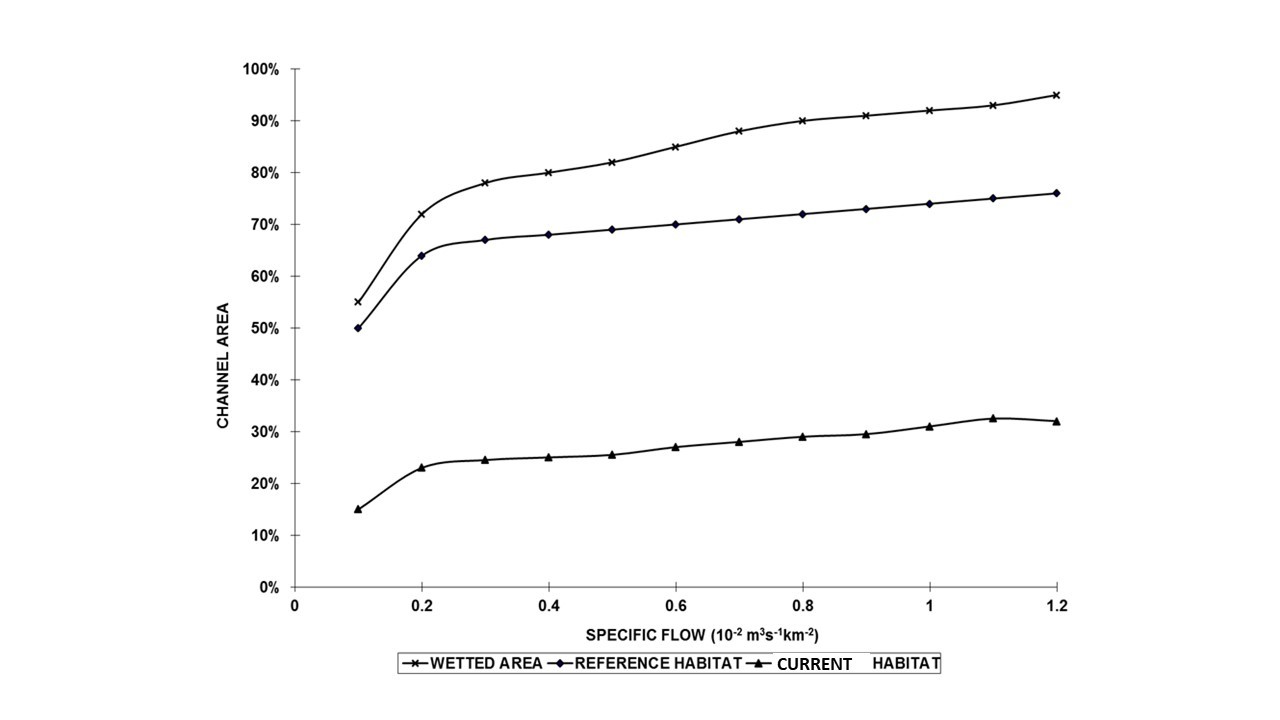
Figure 5. An example of habitat rating curves for generic fish representing entire amount of suitable habitat and for community habitat, which is a sum of habitat for individual species weighted by their expected proportions in the community. The flows (X-axis) are standardized to the watershed area. The suitable habitat at reference conditions, expressed as proportion of river channel area (Y-Axis), is available across most of the wet area, however the current habitat is much lower indicating that more habitat is available to less common species.
This opens a number of analytical possibilities, which will help to define and test adaptive management scenarios also to counteract climate change impact. Development of these procedures is currently underway in the Work Package 2 team.
Within our team in AMBER, the above techniques are applied and tested on a number of rivers of different sites and character. In Poland, major effort is invested into applications for large rivers testing it on Vistula River downstream of Włocławek dam. We have also begun surveys on rivers in Scotland, Denmark and Germany. Plans are also to investigate Irish, Spanish and French rivers. We started training sessions for local scientists in the data collection described above.
